

What we found:
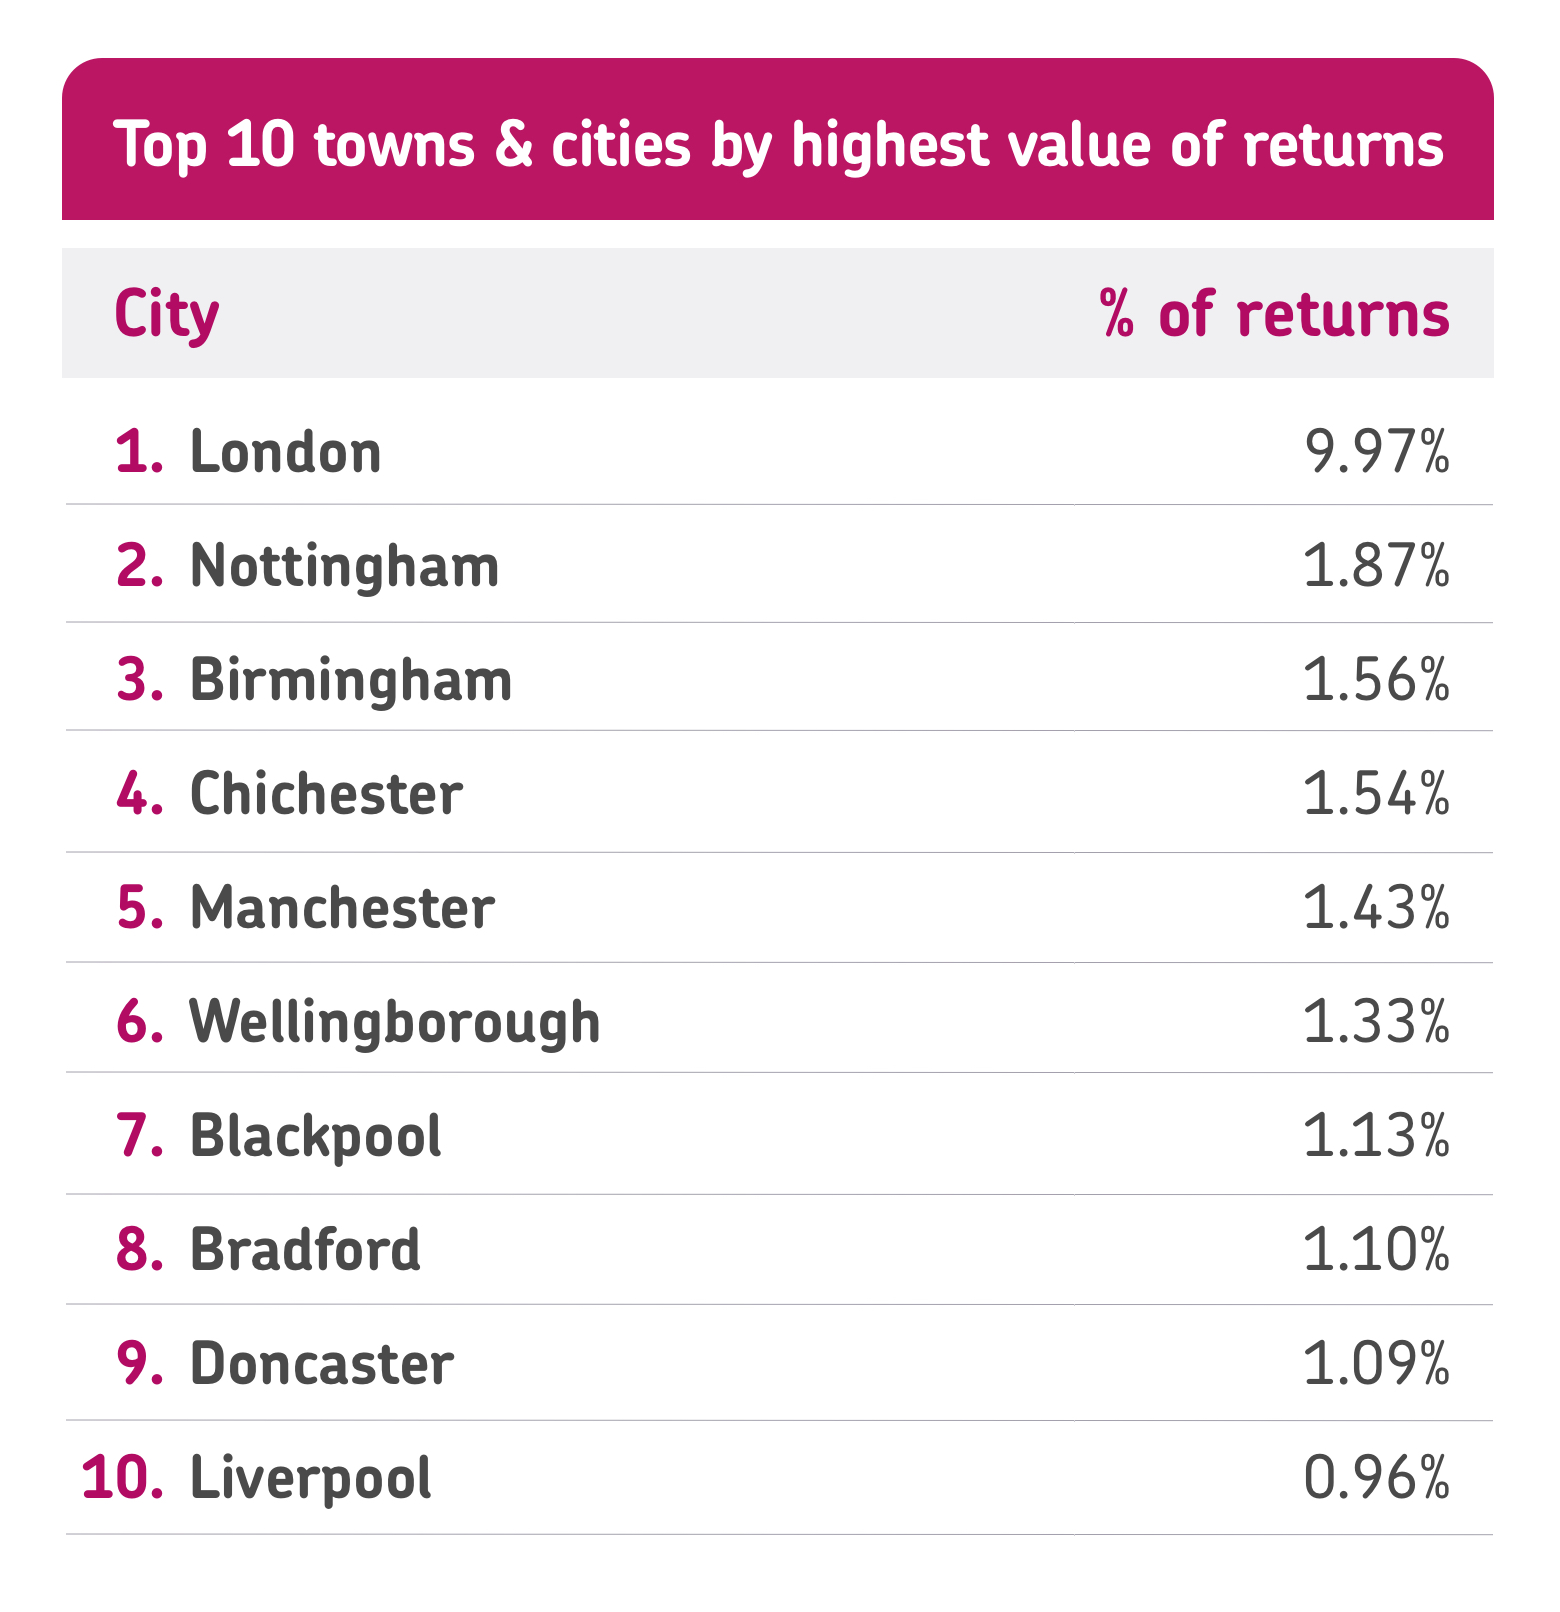
- Londoners return more than any other city, accounting for nearly 10% of all UK returns and a total of over £12 million
- After London, Nottingham processes the next-highest value returns with over £2.2 million in products, and Kent has the next highest amount of returns with over 72,000 transactions
- Retail businesses processed the biggest number of returns, with over 13% of all UK refunds
- The building trade industry has the highest value of returns, totalling over 14% of all refunds processed in the UK at over £17 million
- This was followed by the building trade (11%), the medical industry (5%), hotels (3%), and hair and beauty businesses (2%)
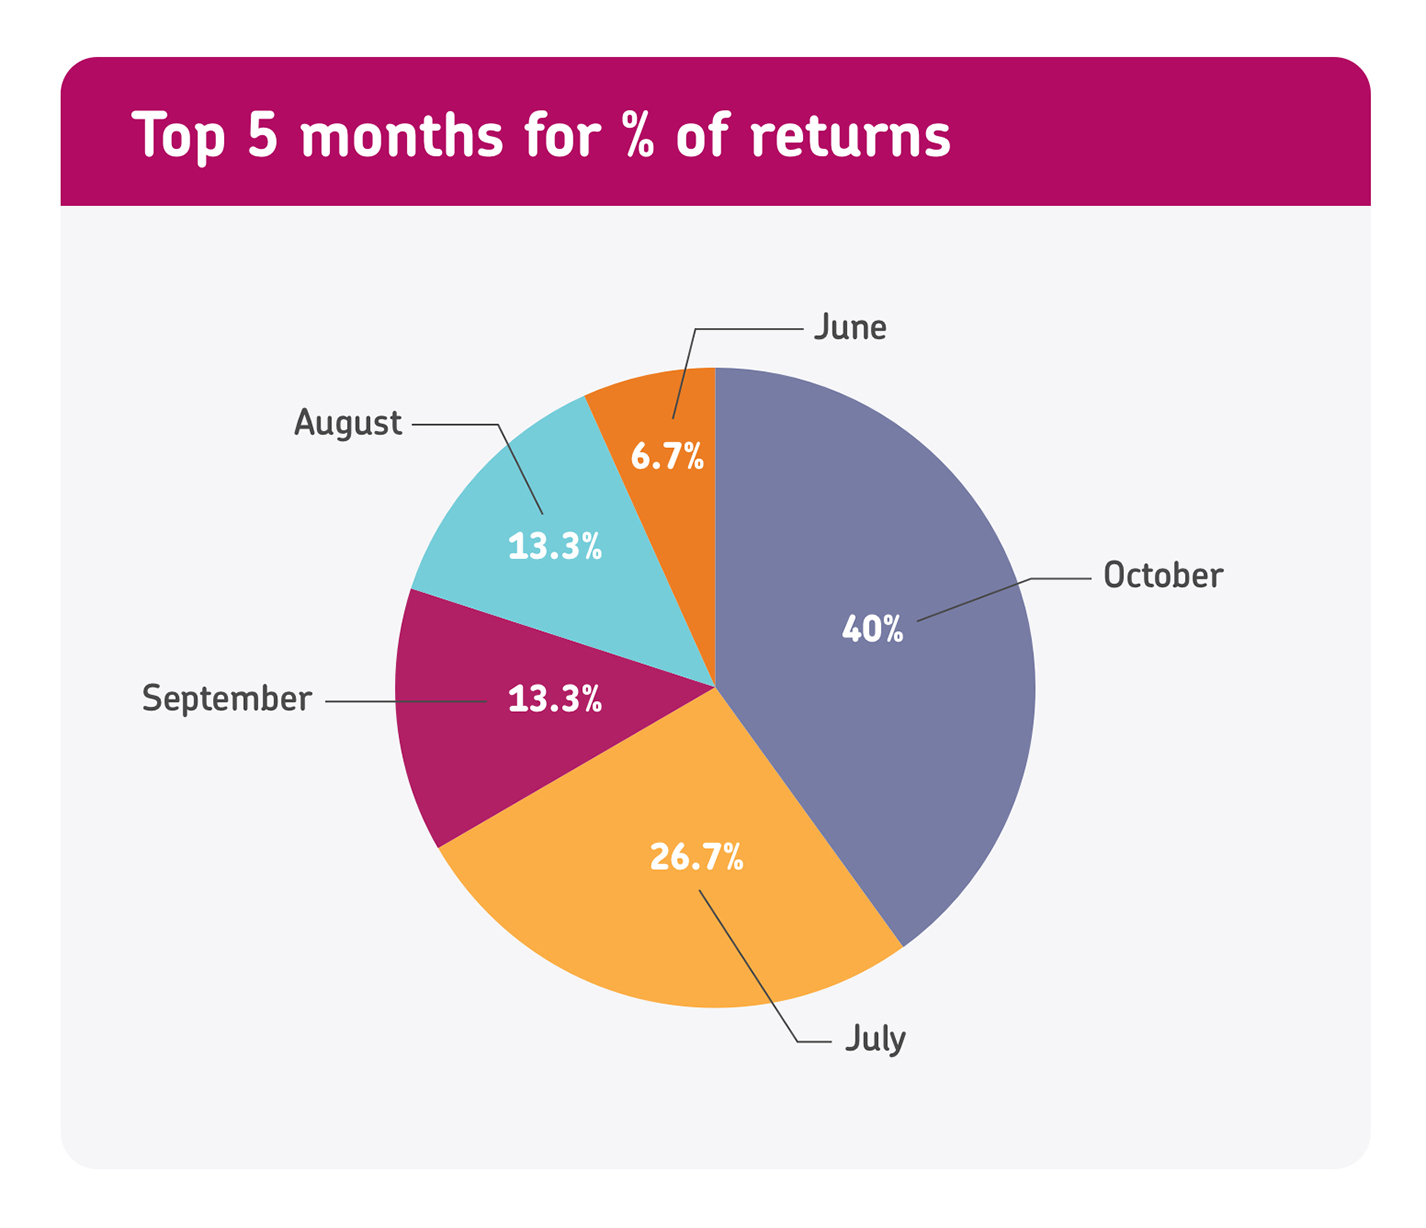
- People returned the most in October, followed by July and September
The notion of ‘Buy, Try, Return’ is the phenomenon of shoppers purchasing online and returning items once they’ve had a chance to see or try them in person. It’s an increasingly common habit, with fashion retailers being hit particularly hard; apparel returns cost the fashion industry £7 billion in 2022. Of course, it’s not just exclusive to e-commerce orders, but online stores are seeing up to 50% of products being returned compared to an average of 10% for purchases made in brick-and-mortar shops.
‘Buy, Try, Return’ is particularly prevalent following the festive season. The Royal Mail even dubbed the 2nd January 2024 as ‘Takeback Tuesday’, and predicted that online returns would rise by 52% against December 2023.
With returns costing retailers £20 per parcel on average due to shipping, having a strategy in place to help prevent returned orders from crumbling businesses’ profits is crucial.
To better understand how stores can prepare for peak periods, we reviewed takepayments returns data from thousands of UK businesses using our card machines and point-of-sale (POS) systems from November 2021-2023.
Our findings revealed the months with the highest return traffic, which regions’ consumers are the most likely to send items back, and which industries can expect the highest influx of refunds.
Refunds at a glance
The data shows that the total value of refunds is down 11% year on year, with the overall number of refunded transactions also decreasing 6% year on year.
While it may seem promising for businesses who are hoping to curb their return rates, it’s possibly a consequence of British retail sales seeing the most significant drop since January 2021. The cost of living crisis was, and continues to be, a concern for people across the country, with many consumers cutting back on spending and therefore causing the rate of processed returns to decrease.
Customers were also returning the most between the months of June to August. A higher footfall of traffic and consumers shopping for seasonal clothes ahead of the summer holidays may play a significant role in the higher rate of returns throughout this period.
Refunds by industry
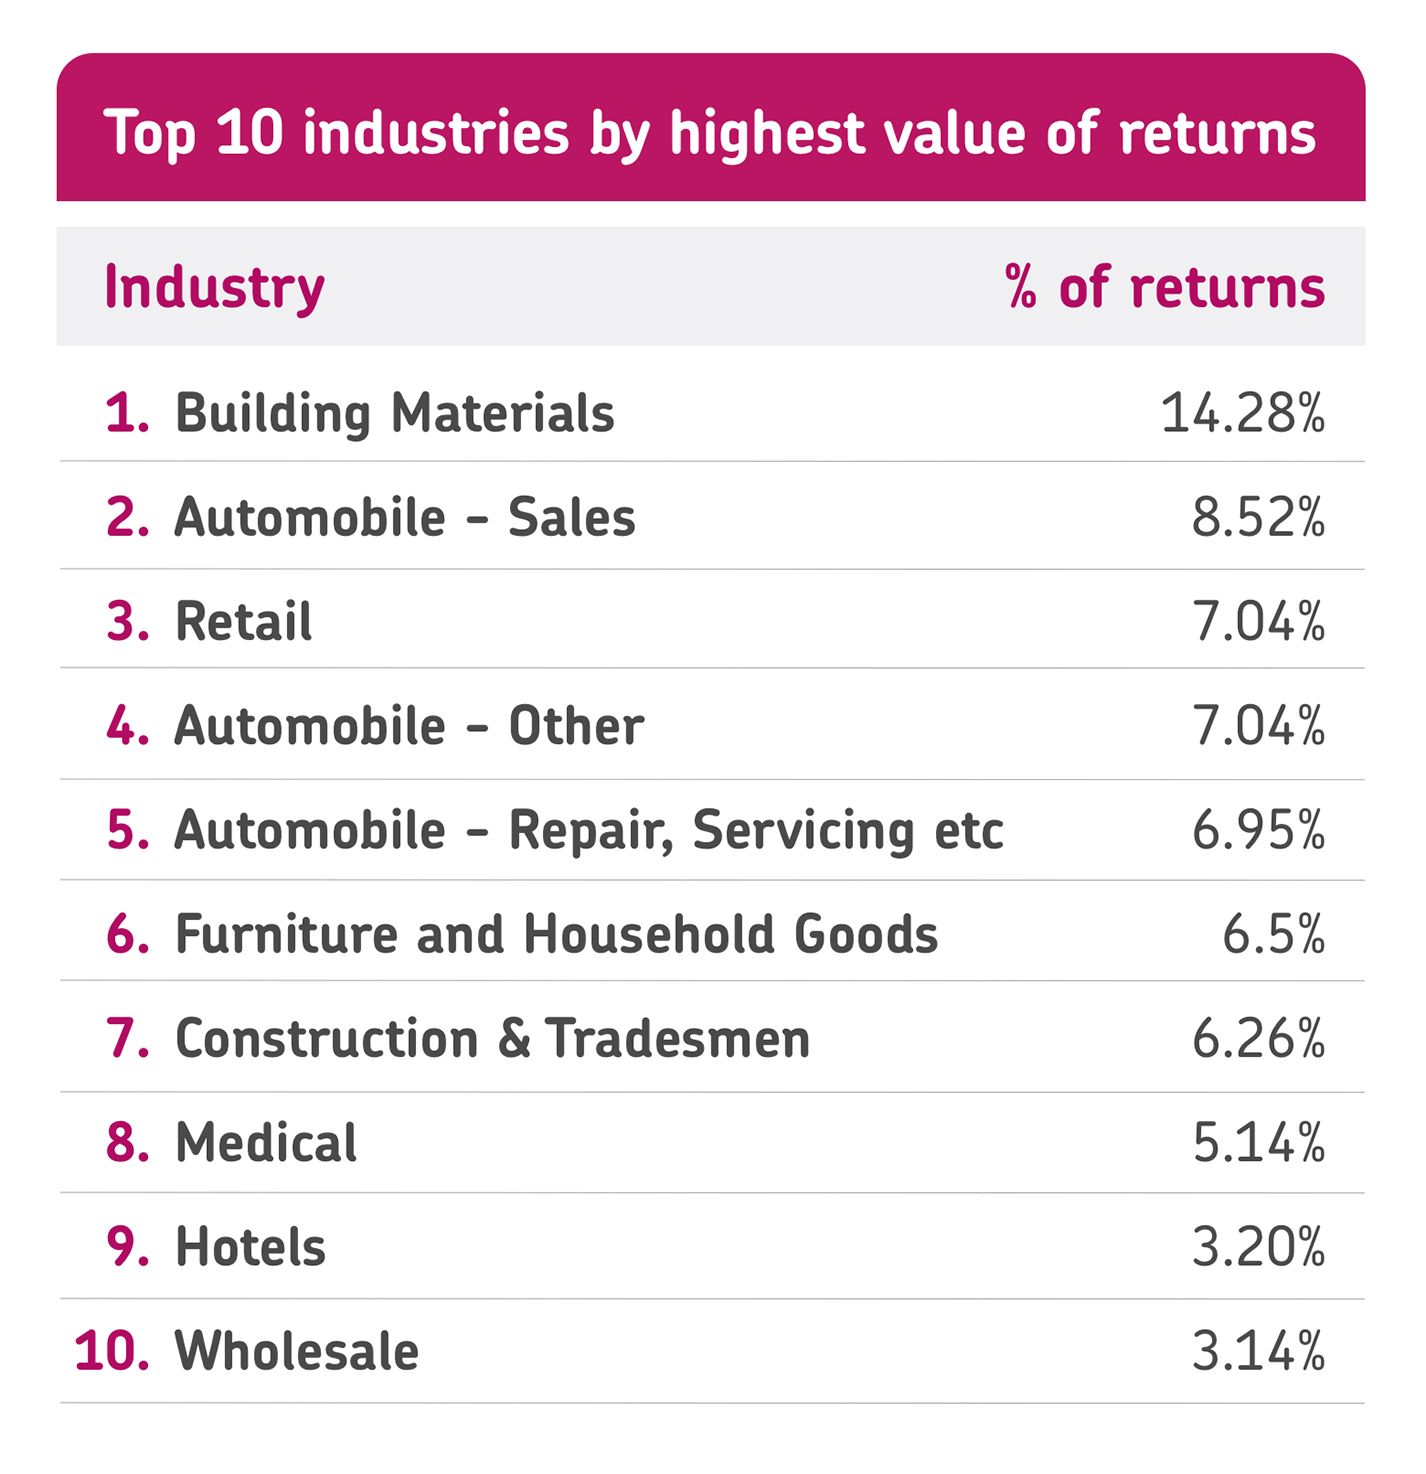
The construction and building trade tops the charts in refund value
The building trade has emerged as the sector with the highest value of refunds, accounting for over 14% of the total refund value in the UK and amounting to more than £17 million.
Building projects, whether small renovations or large constructions, involve substantial financial commitments and higher average building work expenses likely lead to larger refunds compared to other sectors.
And unlike more straightforward transactions in retail or hospitality, building projects are more prone to changes or cancellations, which can also result in more instances of refunds. 91% of construction professionals reported being involved in delayed projects, which can be attributed to changing customer requirements, unforeseen structural challenges, and fluctuating material prices.
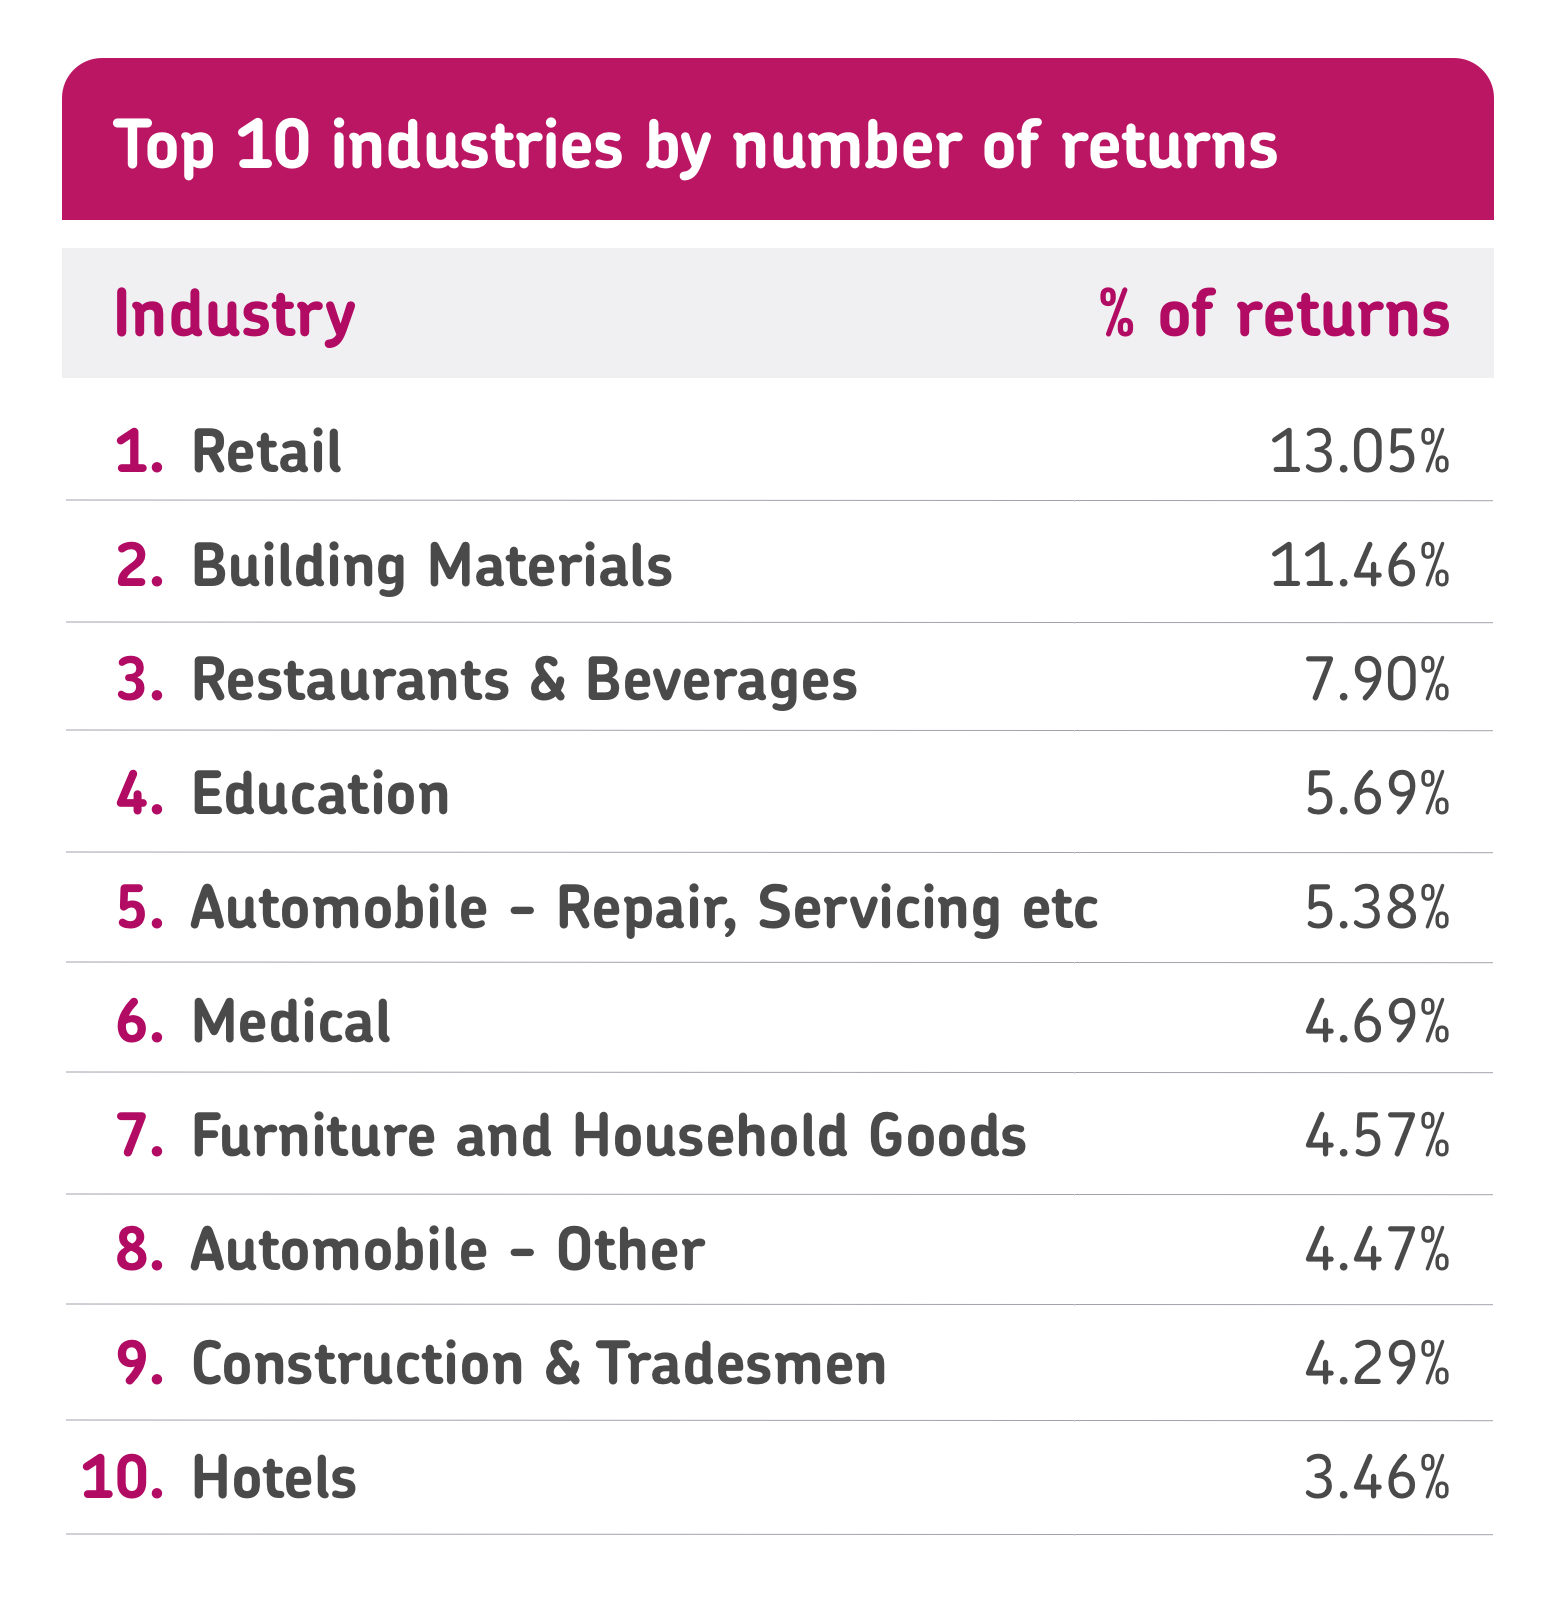
Retail reigns in the highest number of refunds and building trade follows closely
Unsurprisingly, the retail sector had the highest number of refunds, accounting for over 13% of all processed in the UK and hitting an eye-opening value of £8.5 million. This possibly reflects the sector's high overall transaction volume and a growing number of returns options available.
Following closely, the building trade holds its ground as a close second with 11% of the total number of refunds.
Other industries also made notable contributions to the refund pool, especially those specialising in non-goods-related sales. The medical sector saw 4.6% of refunds, and hotels accounted for 3.4%, likely due to booking cancellations and changes in travel plans.
The hair and beauty sector also made the list with 2.11% of refunds, which also hints at the discretionary nature of these services. These industries aren’t necessities but luxuries, which consumers can change their minds about when financial challenges strike – possibly as a result of the turbulent economic climate.
Refunds by location
Refunds by area
London: The Serial Returners
Nearly 10% of the value of all UK returns took place in London, exceeding £12 million – which also dwarfs the rest of the country regarding the number of returns processed (8.9%).
It’s not totally shocking since the capital is the most densely populated city in the country. London is also home to one of the world's most expensive shopping districts – New Bond Street – which could be driving up the value of returns in the vicinity.
As a well-developed area with a combination of higher disposable incomes, luxury stores, and easier access to a wide range of products, accelerated consumer buying and return behaviour is much more likely.
Nottingham: Not Far Behind
Nottingham processes the next-highest value, with almost 2% of the total value of UK returns and exceeding £2.2 million going back to customers. Nottingham consumers’ return behaviour is a fraction of Londoners, reflecting its much smaller population size.
Refunds by county
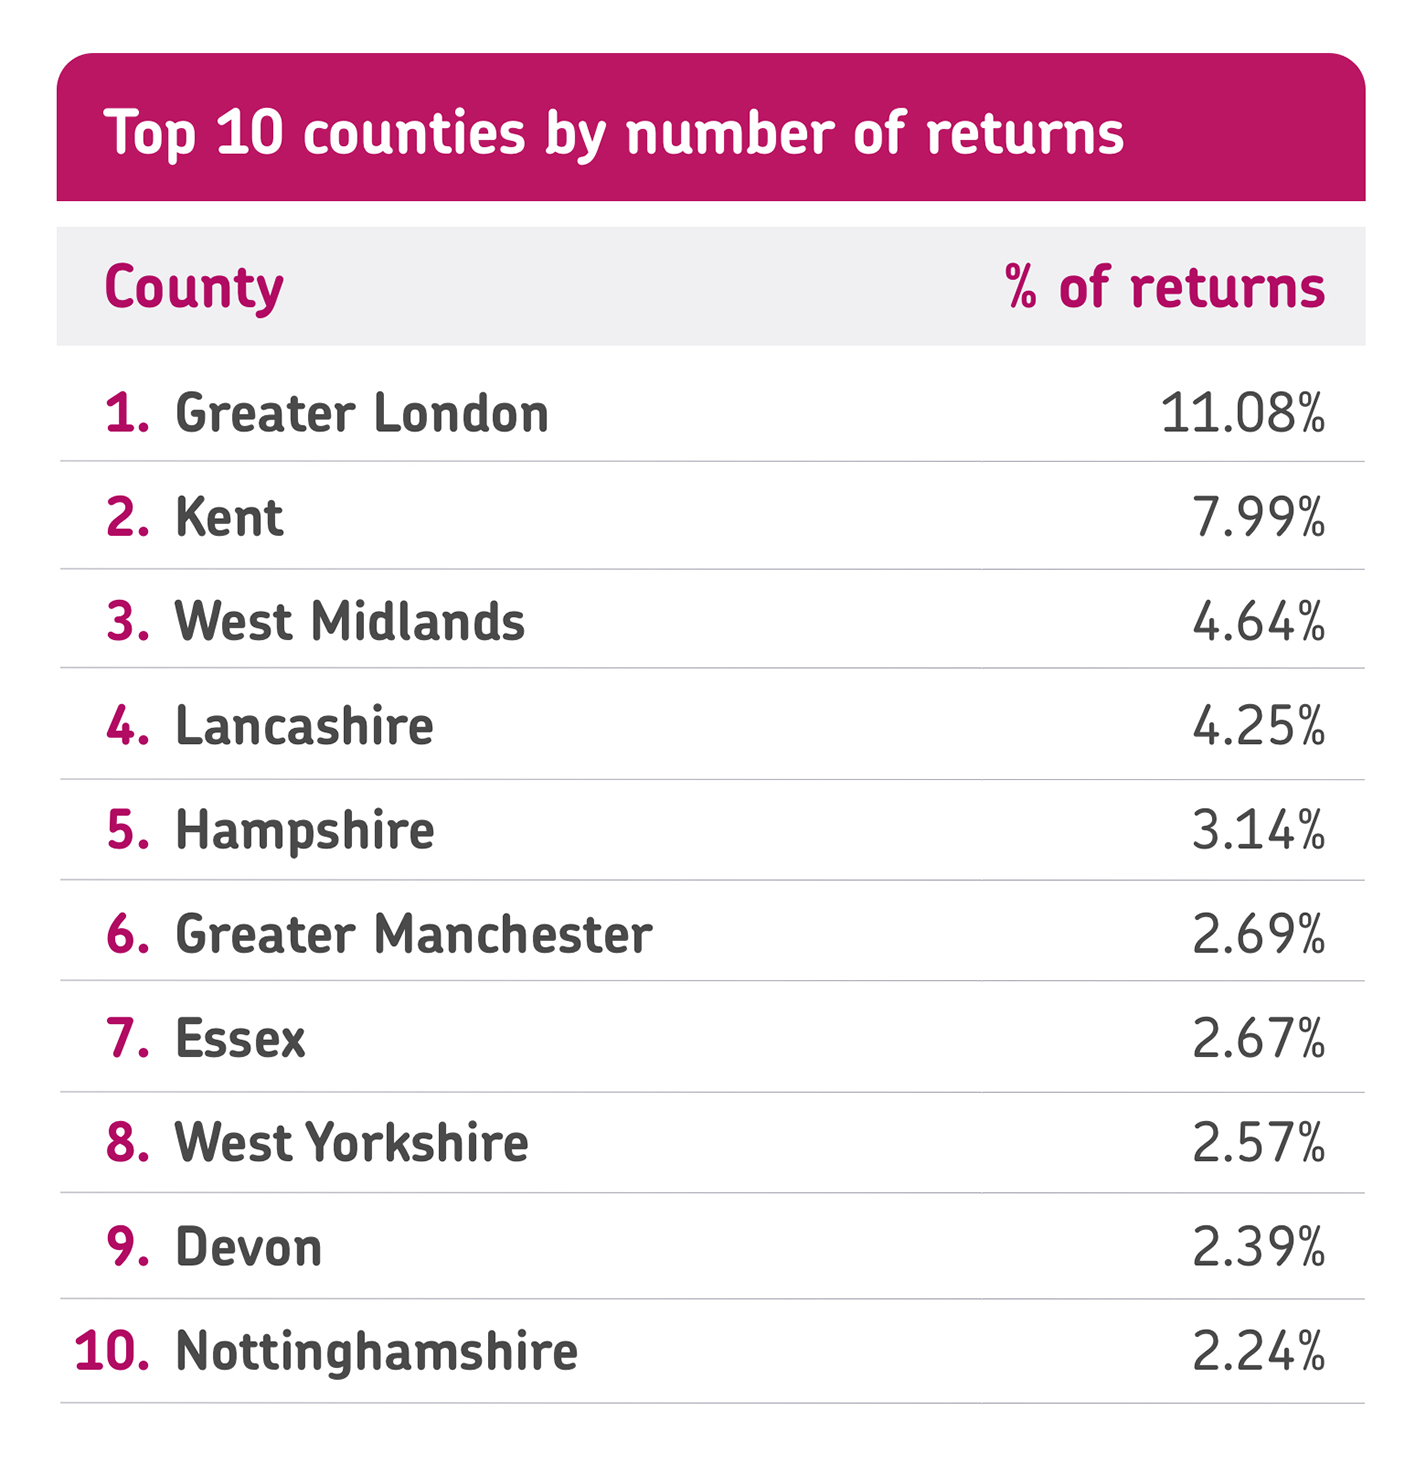
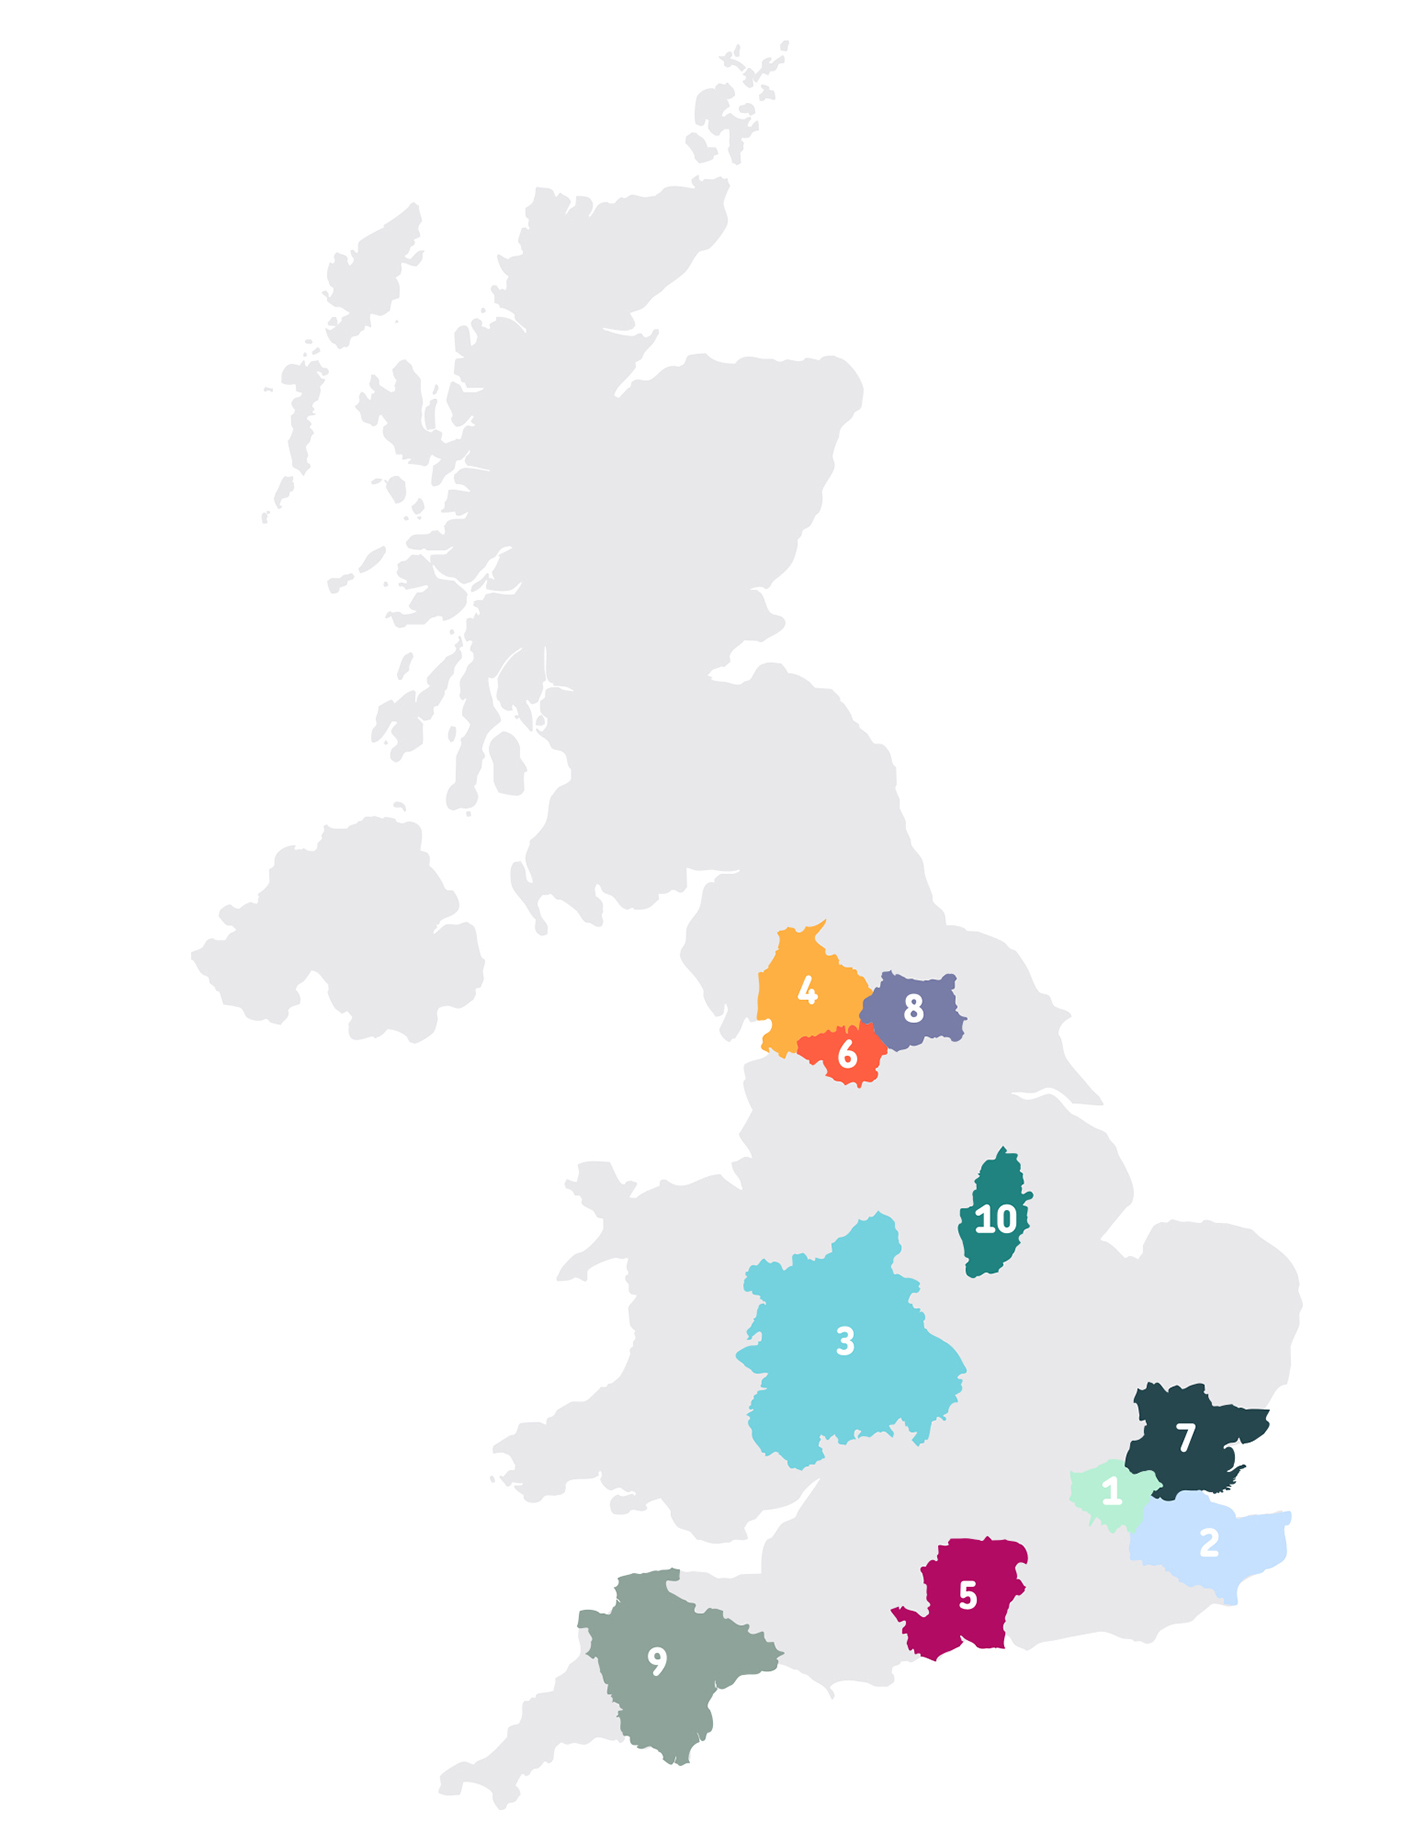
Greater London: The Return Giants
When looking at the country on a county level, Greater London processed the most returns in quantity, with over 100,000 transactions valued at over £14.6 million.
Research into Europe’s busiest retail hubs found that London’s Oxford Street saw the highest footfall out of 34 prime retail streets in Europe’s key cities. A prime indicator of physical retail behaviour, the study also concluded that Regent Street and Covent Garden were the third and seventh-busiest shopping streets.
Three of Europe’s highest-traffic-generating retail locations falling within the Greater London boundary show that it’s an exceptional destination for greater consumer spending and, consequently, returns.
Kent: The Quantity Returners
Kent followed Greater London with over 72,000 transactions, accounting for 8% of the UK's total returned purchases. Kent's high return rate may be influenced by similar factors to Greater London; it’s home to Bluewater, a popular retail location that’s been named the fifth-largest UK shopping centre.
It was also crowned the overall best shopping destination in the country based on various factors like size, the number of shops and restaurants, and the number of parking spaces. PwC's UK Retail Outlook for 2023 previously outlined accessibility as one of the key factors shaping retail trends, which could explain how Bluewater helped Kent become such a hotspot for transactions.
Lancashire: Return Value Champions
Lancashire takes the second spot when looking at return value, sending back products worth a total of £5.8 million.
Our key takeaways for small businesses
Jodie Wilkinson, Head of Strategic Partnerships here at takepayments, explains what our key findings mean for small businesses.
“Our research shows that a total of £121 million worth of goods were sent back to businesses using takepayments terminals, with the money being refunded to customers in the UK between 2021-23. Plus, if online returns are costing retailers £20 per parcel on average due to shipping, that’s an estimated loss of over £8 million to e-commerce businesses all across the country (based on our total online return numbers multiplied by the average cost of an online return).
Here’s how business owners can use our insights to better manage their returns processes:
- Make seasonal adjustments – With a spike in returns during the summer months, businesses could explore seasonal staffing and inventory adjustments. This may involve training staff on efficient return handling procedures and ensuring that return policies are clearly communicated to customers during these peak months.
- Regional focus – London's significant share of UK returns speaks to a need for a regional approach to return policies. Businesses in high-return areas should consider more flexible return policies and efficient processing systems to handle larger volumes.
- Industry-specific approaches – Sectors experiencing the highest value of returns, like building, automobile, and retail, may want to implement stricter return verification processes to manage high-cost transactions. This might include detailed product descriptions and transparent communication of return policies to preempt misunderstandings leading to returns.
- Retail sector strategies – Retail businesses, which lead the pack in the number of processed returns, could prioritise efficient and customer-friendly return processes. This includes simplifying the return procedure, offering multiple return options, and investing in hi-tech POS systems to help businesses track and analyse return trends for better inventory management. Many retail brands are now also implementing fees when customers return orders to help recoup shipping costs, which could encourage consumers to shop more intentionally, reducing the rate of returns.”
Our all-in-one POS system features powerful reporting capabilities and stock management features to make your business run smarter.
Find out more about how takepayments can transform your card payments.
What 2024 has in store for refunds
John Clark, Product Manager at takepayments, offers his perspective on how consumer returns behaviour might look in 2024.
"Looking ahead to 2024, we expect a few key trends in return behaviours that businesses should be prepared for. Firstly, we anticipate an increase in online returns driven by the continued growth of e-commerce. With more consumers shopping online, we’ll likely see a corresponding rise in the volume of returns, particularly in sectors like clothing and electronics.
Plus, we expect to see a greater emphasis on sustainable and responsible return practices. Consumers are becoming increasingly more eco-conscious - 86.5% of Brits are making more eco-conscious decisions - which will likely influence their decisions regarding returns. Businesses might respond by offering more sustainable packaging options, implementing restocking fees to discourage frivolous returns, or even encouraging exchanges over refunds to reduce waste.
To navigate the landscape of consumer behaviour, however, it looks in the upcoming year, there are always best-practice tactics businesses should follow to keep their customers – and their bottom line – happy.
- Understand the reason for return – Implementing a system to track and analyse return reasons can provide valuable insights. It can be done simply by including feedback forms in each order, or online forms if businesses are reducing their paper waste. By identifying the common reasons, businesses can address underlying issues, be it product quality, sizing discrepancies, or customer expectations.
- Prioritising customer service – Exceptional customer service is key, as a positive return experience can retain customers and encourage repeat business in the future. This includes providing clear communication, easy-to-follow return instructions, and a hassle-free process. Offering assistance and solutions, such as exchanges or store credit, can also enhance customer loyalty.
- Provide clear and accurate product information – Ensuring that all product information is accurate, detailed, and easy to find gives customers comprehensive product information. It can help them to make a more informed choice when purchasing. This could be in the form of high-quality images, detailed descriptions, accurate sizing charts, and customer reviews.
- Make sure you’re complying with refund laws – It’s crucial to understand and comply with legal obligations regarding customer rights and refunds. Familiarise yourself with the Consumer Rights Act 2015, which requires all products and services to be of satisfactory quality, fit for purpose, and as described. Your customers also have the right to request a refund within 30 days of purchase. Transparent, fair, and legally compliant return policies protect the business and build customer trust.
- Stay vigilant against returns fraud – Return fraud is a growing concern, particularly within the retail sector. It encompasses several dishonest tactics customers use to return products for a refund or store credit. Wardrobing – buying, wearing, then returning clothing – is a common one to look out for, but consumers falsely claiming that their goods were damaged or missing on arrival is also becoming popular. Keeping up-to-date on the latest trends can give your business the insight it needs to combat returns fraud.”
Keep up with the latest industry news with takepayments
As well as making payments easy, our original data reports and tools can arm your business with the insights it needs to make smarter decisions.